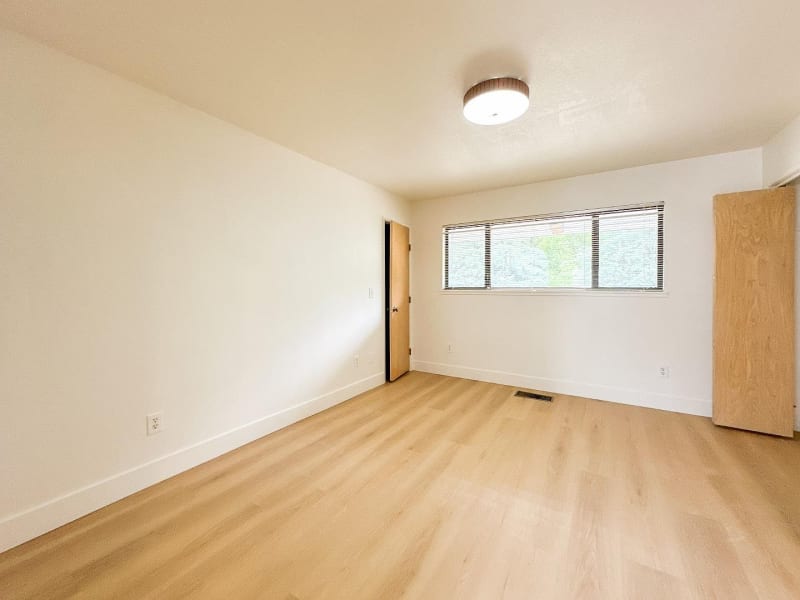
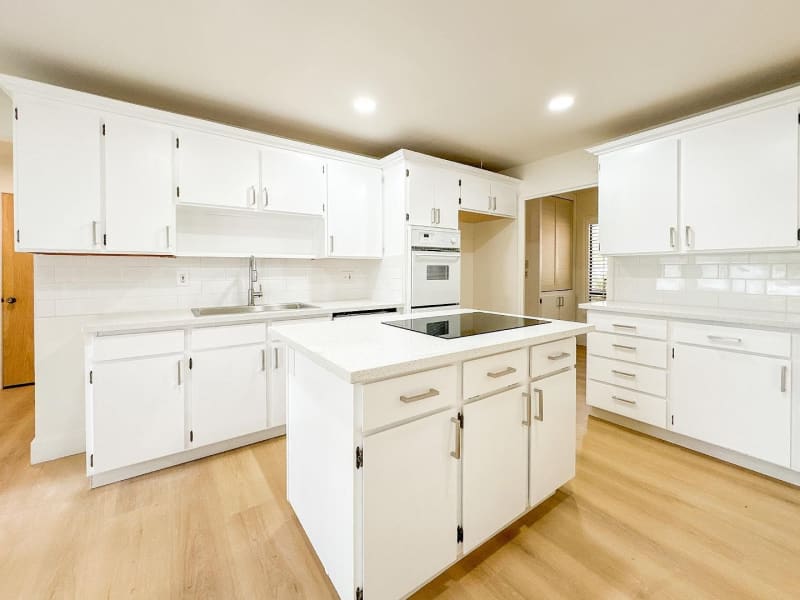
Discover this single family home located at 20521 Upper Hillview Dr in Sonora, CA. Built in 1975, this residence offers 3 bedrooms and 3 bathrooms across 2816 sq ft of living space. The property is vacant and sits on a substantial 23081 sq ft l...
This 3 bedroom, 3 bathroom property is located in Sonora, CA. With 2,816 square feet and built in 1975, this property presents a great opportunity for investors and home buyers alike.
What this place offers
3 Bedrooms
3 Bathrooms
2,816 sqft
23,081 SqFt
Built in 1975
2 Parking Spaces
Central
Tuolumne County
Key Features
Cash Only
Eviction Partner
Documents
Preliminary Report
Listing Agent Info
Alfred Younan
(408) 728-5468
alfred@metro-realtypros.com
Brokerage
Metro Realty Pros
Managing Broker
Alfred Younan
License # 01718008
Register to view Agent's Details
20521 Upper Hillview Dr
Sonora, CA 95370
3 bed•3 bath•2,816 Sq. Ft.
Purchase Price
$30,386
Net Annual Cash Flow
+$2,532/mo
Income
Gross Annual Rent
$2,680/mo × 12 — rental estimate from Vihara Analytics · Aug 2026
Annual property tax from Alameda County assessor records via Vihara Analytics (2026)
−$1,774
HOA Dues
$0/mo × 12 — from listing data (Victoria Court HOA)
−$0
Property Management
Net revenue × 0% — industry standard for long-term rental management. Adjust below.
−$0
Maintenance Reserve
Purchase price × 0% — standard reserve for repairs & upkeep. Adjust below.
−$0
Total Expenses
Property Tax + HOA + Management + Maintenance
−$1,774
Net Cash Flow
Annual Net Cash Flow
Net Revenue − Total Expenses
$30,386
Source: Vihara Analytics · 2026
$117,900
Total Cash Required
to close this deal
Cash at Closing
Down Payment
Purchase price × 20% — adjust below
$94,320
Closing Costs
Purchase price × 5% — standard estimate for CA. Adjust below.
$23,580
Total Required
Down Payment + Closing Costs
$117,900
Adjust Assumptions
Down Payment
% of purchase price paid upfront. Typical: 20–25% for investment properties.
%
Closing Costs
% of purchase price. California avg: 2–4%. Includes title, escrow, transfer tax.
%
Vacancy Rate
% of year property sits vacant. Oakland market avg ~5%. Affects net revenue.
%
Mgmt Fee
% of net rent paid to property manager. Industry standard: 8–12% for LTR.
%
Maintenance
% of purchase price reserved annually for repairs. Rule of thumb: 1% per year.
%
Sonora Market Context
Market factors used to inform your calculation assumptions
Market Vacancy Rate
Sonora rental vacancy rate per U.S. Census ACS 2023. Your default assumption of 5% is slightly conservative — a reasonable buffer for investor planning. Source: U.S. Census Bureau ACS 2023
~4.2%Sonora rental market
Price vs. Market estimate
Purchase price $471,600 vs Vihara Analytics estimated value $566,000. A purchase below estimated value provides a built-in equity cushion. Source: Vihara Analytics · Aug 2026
17% belowEst. value $566,000
Median Sold Price
Sonora median sold price over last 30 days. Contextualizes how this property is priced relative to the broader market. Source: Vihara Analytics · Aug 2026
$205,000Trend: ↑ Rising
Avg Days on Market
Properties in Sonora sit on market for 23 days on average. Higher DOM can indicate negotiation leverage for buyers. Source: Vihara Analytics · Aug 2026
23 daysSonora market
Rent-to-Price Ratio
$2,680 monthly rent ÷ $471,600 purchase price. Sonora market avg is ~0.5–0.7%. Above 0.7% is considered strong for this market. Source: Vihara Analytics · Aug 2026
0.57%Monthly rent ÷ purchase price
⚠️ Market factors are estimates based on available data and public records. They inform but do not replace professional investment advice.
$32,160
Projected Annual Revenue
Monthly rent of $2,680 with 0% vacancy rate accounts for the net annual revenue projection.
Monthly Rent$2,680
Annual Revenue (Gross)$32,160
Vacancy Rate0%
Annual Revenue (Net)$32,160
Source: Vihara Analytics · 2026
Investment Metrics
Cap Rate
Annual Rent ÷ Purchase Price × 100
+6.44%
Cash on Cash Return
Monthly Rent ÷ Purchase Price × 100
+25.77%
Purchase Price
Current bid or starting bid from auction listing
$471,600
Comparable Sales
Comparable sales data not available for this location.
Property Tax Assessment
Annual property tax information for 2026. This data is sourced from county tax assessor records.
Annual Property Tax
2026
$1,774
Monthly Estimate$148
Assessed Value
2026
$420,000
Effective Tax Rate0.42%
Important: Property tax information is sourced from county tax assessor records and public property databases. Actual tax amounts may vary based on exemptions, special assessments, and other local factors. Please verify with your county tax assessor for the most current information.